
RACIAL & ECONOMIC DISPARITIES
Photo Credit: Mark Lennihan | Associated Press
Estimated Test Scores (CA vs. OH)

The visualization reveals a consistent decline in average test scores across all racial groups over time, indicating a widespread negative impact of the COVID-19 pandemic on student achievement within the California educational system. The bar chart further highlights persistent patterns of educational inequality: Black students consistently exhibit the largest negative deviation from mean test scores, followed by Hispanic students, while white students maintain positive deviations from the mean. These disparities, which existed prior to the pandemic, appear to have been exacerbated in its aftermath.
In Ohio, the data shows an overall decline in average test scores from 2017 to 2022, with a notable increase in 2023. This suggests potential educational policy changes aimed at recovering from the pandemic’s negative impact. However, similar to California, racial disparities persist. For the “all” subgroup, there are only positive deviations from the mean test scores from 2017 to 2023, while Black and Hispanic students consistently show negative deviations. This underscores pre-existing achievement gaps across racial groups, which have been further highlighted by the pandemic.
To better understand these trends, it would be valuable to examine the relationships between educational policies in California and Ohio, particularly how each state adapted to changes such as the shift to remote learning. Analyzing these policies could provide insights into the effectiveness of interventions aimed at mitigating the pandemic’s impact on student achievement and addressing long-standing inequities in education.
The Effects of Socioeconomic Status on Test Scores (CA vs. OH)

This visualization looks into the effect of socioeconomic backgrounds on math and reading scores for students in California and Ohio throughout the years 2017-2023. From the visualization, it is evident that there exists an achievement gap based on socioeconomic status in the US education system. Students classified as economically disadvantaged consistently show negative deviations from mean test scores across both subjects throughout the 2017-2023 period, while their non-economically disadvantaged peers maintain positive deviations. Both groups experienced declining test scores after the COVID-19 pandemic. Economically disadvantaged students in California seems to have greater negative deviation compared to those of Ohio. In both states, there is an increase in test scores from 2022 to 2023, with Ohio having greater increases.
Comparison of Math & Reading Performance by Student Subgroup (2023)
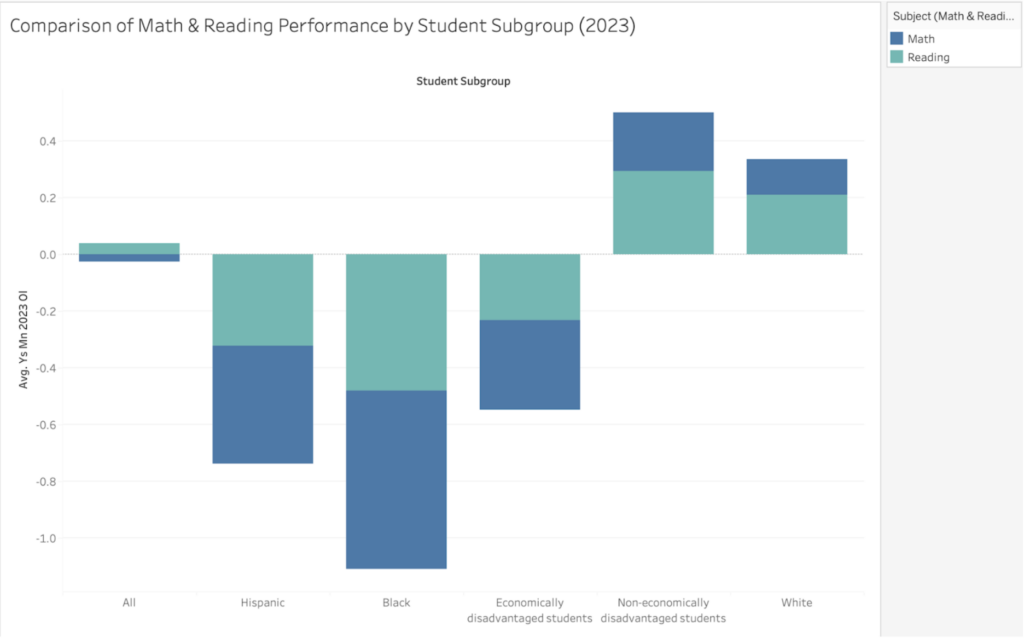
The stacked bar chart visualizes the average differences in math and reading performance among various student subgroups for the year 2023, as the U.S. and the rest of the world is recovering from the COVID-19 pandemic. Each bar is segmented by subject area, with math performance represented in blue and reading performance in teal. The baseline is 0 at the y-axis, which marks the average performance for all students combined. The data visualization highlights disparities across racial, ethnic, and socioeconomic lines.
Most notably, Hispanic and Black students exhibit significant deviations from the mean, with both math and reading scores falling well below zero. Hispanic students average around -0.7, math scores contributing around -0.4 and reading scores around -0.3. Black students have the largest gap averaging nearly -1.1 below the mean, with math scores especially low compared to other student subgroups. This suggests systemic inequities that are tied to historical and social factors.
Economically disadvantaged students also show lower average scores than their non-economically disadvantaged peers. Economically disadvantaged students performed approximately -0.5 below the mean and their counterparts scored positively with +0.4 above the mean. This suggests that socioeconomic status strongly correlates with academic performance. This potentially reflects disparities in access to educational resources, support systems, and opportunities.
In contrast, non-economically disadvantaged students and white students have higher performance in both subjects with positive average differences from the mean. Not to mention, the gap between math and reading scores vary across all subgroups, but math is consistently lower than reading scores, which suggests that additional support in math education might be needed.