
IMPACT ON ACADEMICS & TEST SCORES
Photo Credit: C2 Education
Comparison of Math Scores for Several States
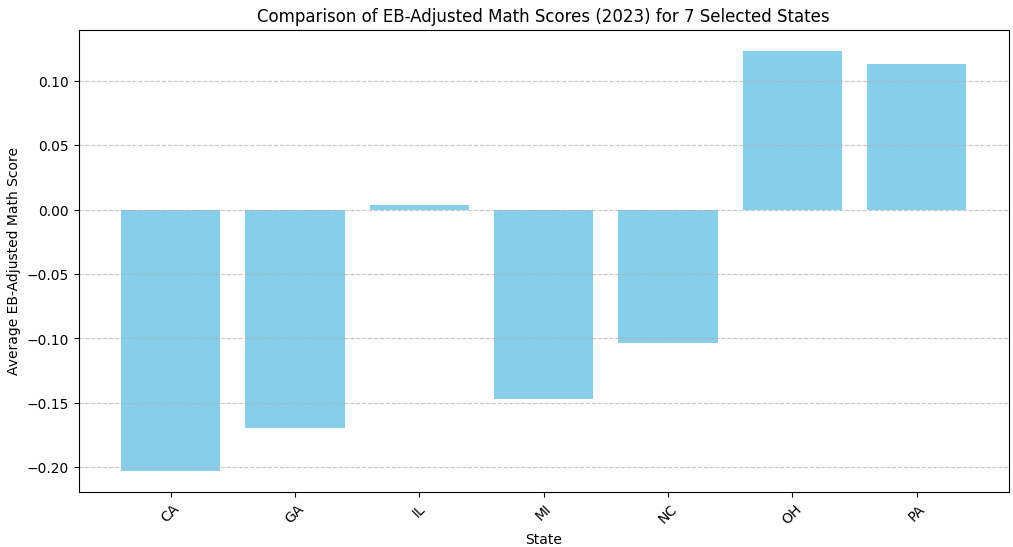
A bar graph here allows us to quickly visually inspect the differences in scores and the magnitude of the differences in standardized test scores for mathematics across states. A bar graph allows us to see how one state has substantially lower scores when compared to the national average calculated from the 2019 National Assessment of Educational Progress Data. An observer can quickly follow the horizontal axis to find a desired state and compare it withother states.
A negative score here implies that a state was below the national average calculated from the 2019 National Assessment of Educational Progress Data. Out of the selected 11 states, California performed the worst with math test scores that were far lower than the national average, even when compared to other states. However, states like Ohio and Pennsylvania were above the national average. For our project, we could more closely examine what education policies are implemented by these states to see how states like Georgia and California can improve their test outcomes.
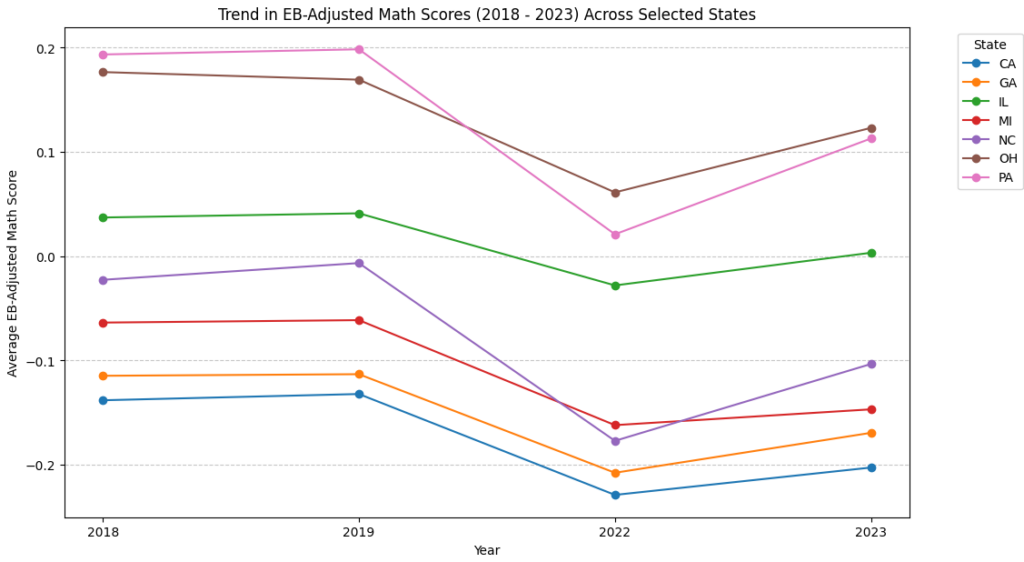
A line chart is particularly useful for showing trends over time, which is why it was chosen here. The use of different lines to represent different states allows an observer to quickly see the changes and trends over time for the various states. The usage of different colors allows an observer to quickly distinguish between different states and quickly use the map legend to identify a particular trend for a particular state over time. This line chart tracks Empirical Bayes (EB)-adjusted math scores from 2018 to 2023 across 11 selected states. Because the data is standardized using a national average, we are able to compare the standardized test scores across states. A negative score here implies that a state was below the national average calculated from the 2019 National Assessment of Educational Progress Data. For instance, we can see that California was below the national average in 2018 and 2019. We can also see that nearly every state had lower scores in 2022 when compared to other years. This would seem to suggest that COVID-19 pandemic is heavily correlated with lower standardized test scores in mathematics assessments.
Map: Changes in Test Scores in CA School Districts (2019 vs 2022)

To visualize the impact of the COVID-19 pandemic on California school districts, we obtained a dataset from the National Center for Education Statistics containing zip codes for each school district in California and merged it with the SEDA2023 dataset. Additionally, we created a new column to calculate the change in test score deviation from 2019 (pre-pandemic) to 2022 (post-pandemic) to highlight the pandemic’s effect. Using Tableau, we then developed a map that represents these changes in test score deviation through a color scale, allowing for a clear comparison across different school districts. The map highlights that the majority of school districts in California experienced a negative change in test score deviation (indicated by the predominant orange shading), underscoring the widespread adverse impact of the COVID-19 pandemic on student performance across the state. This visualization is significant because it provides a geographic perspective on the pandemic’s effects, revealing regional patterns and disparities in educational outcomes.
However, the map also reveals a critical limitation: when analyzing different subgroups, there is significantly less data available for Black students compared to other subgroups in California school districts. This disparity in data representation suggests that our visualizations may be biased, as not all subgroups are equally represented. This limitation is significant because it raises questions about the completeness and equity of the data, potentially obscuring the full extent of the pandemic’s impact on underrepresented groups. Addressing this data gap is essential for developing targeted interventions and ensuring that all students receive the support they need.